Plenix 2026.10.6 — Custom rows, date comparison and extra figures for every widget
The last few dashboard widgets with fixed options now run on the full widget builder. Build a widget from your own hand-picked rows, compare Created against Resolved in one chart, and show extra figures such as win rate or completion rate beside every row.
T
The Plenix Team·1 October 2026·3 min read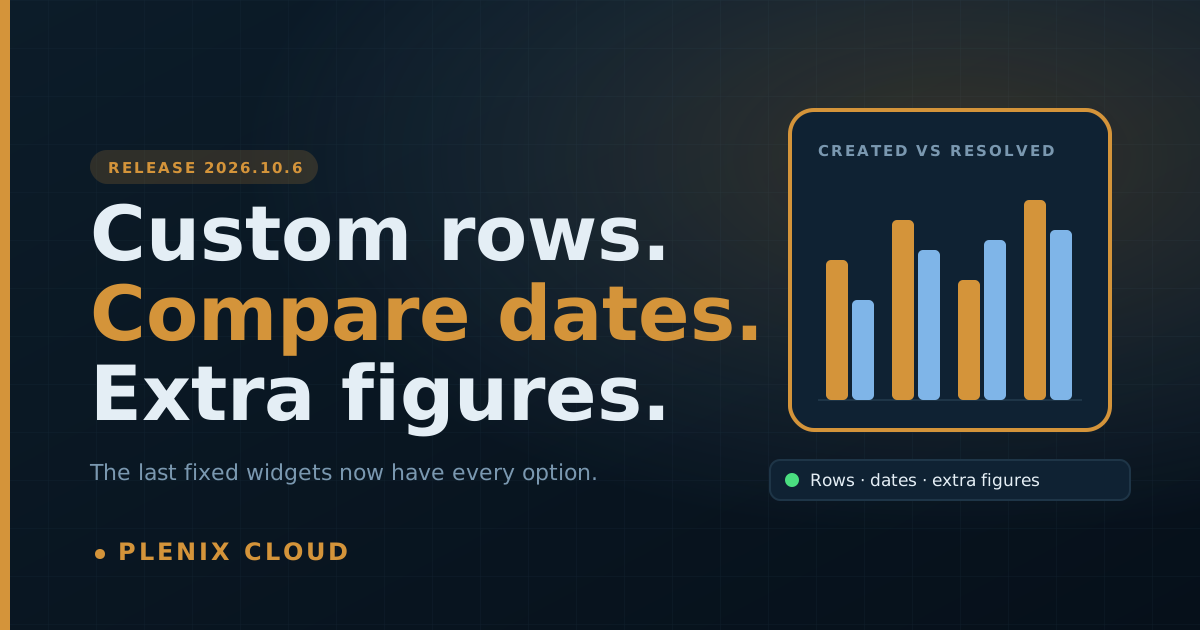
Release 2026.10.6 finishes the dashboard widget work from 2026.10.5. A few widgets still had fixed options because the builder could not express what they showed: Created vs Resolved charts, the ticket summary card, Top Technicians, Top Reps and the Lead Funnel. The builder can now do all of that, so these widgets have every option too, and you can build your own widgets the same way.
New features
- Custom rows. Under Break down by, choose Custom rows to build a widget from rows you define yourself. Give each row a name, a quick scope and any filters, for example "Open", "Critical and still active" and "Waiting on anyone". You can have up to 12 rows. Reorder them with the arrows. Each row is counted on its own, and clicking it opens exactly the records it counts.
- Compare dates. On an over-time chart, pick two or more date fields under Compare dates to draw one series each in the same chart, for example tickets Created against tickets Resolved each day. Bars sit side by side. Click a bar to see the tickets behind it.
- Also show. Add up to four extra figures beside each row of a chart, such as Deals won, Win rate and Open pipeline for each sales rep, or Completed and Completion rate for each technician. They appear as extra columns in tables and leaderboards, under progress bars, on stat cards and in tooltips.
- New ready-made widgets under Compare & Summarise: Created vs Resolved (14 days and 6 months), Ticket summary, Tickets needing attention, Top sales reps, Lead sources, Top technicians and Departed employees.
- New quick scopes and measures. Tickets gain Stalled (no reply or note after 30 minutes), Customer waiting for a reply and Needs attention, which combines the two. Deals gain Win rate, Deals won, Won value and Open pipeline. Leads gain Qualified rate. Work orders gain Completed and grouping by Technician. Employees gain Departed and grouping by the date the record last changed.
Improvements
- Every remaining fixed widget now opens in the full builder. This covers Ticket Volume and the daily and monthly volume charts, Recent Tickets, Needs Attention, the main dashboard's Ticket Summary card and Recent Tickets list, Field Service Top Technicians, CRM Top Reps and Lead Funnel, and the HCM hire trend's Departed view. Each one keeps its title, position, size and the settings you chose, such as the status filter and number of items. All of the builder's other options are added.
- Every figure clicks through. Each custom row, each date series and each ranked row opens the records it counts.
Changes
- Ticket Summary card. Critical now counts critical tickets that are still active, and Waiting includes every waiting status (waiting, waiting on customer and waiting on third party). Waiting used to count only tickets with the plain "waiting" status.
- Needs Attention is now a ticket list using the Needs attention scope. It no longer shows the reason badge on each row. Use the Stalled or Customer waiting for a reply scopes on their own if you want to see one reason at a time.